Click
the Analyze Results icon for
an L-number.
![]()
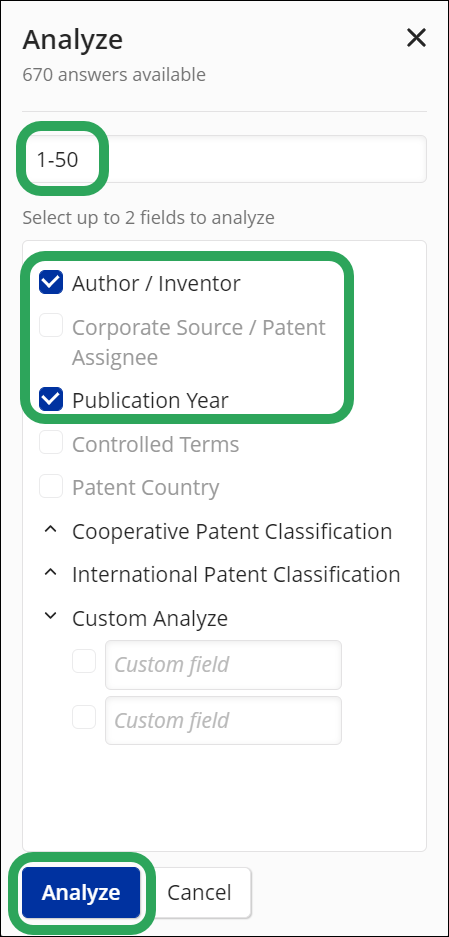
In the Analyze window:
The number of answers for your analysis is prepopulated (up to a limit of 50,000); adjust the number if necessary.
Select up to two fields from the answer set.
Click the Analyze button.

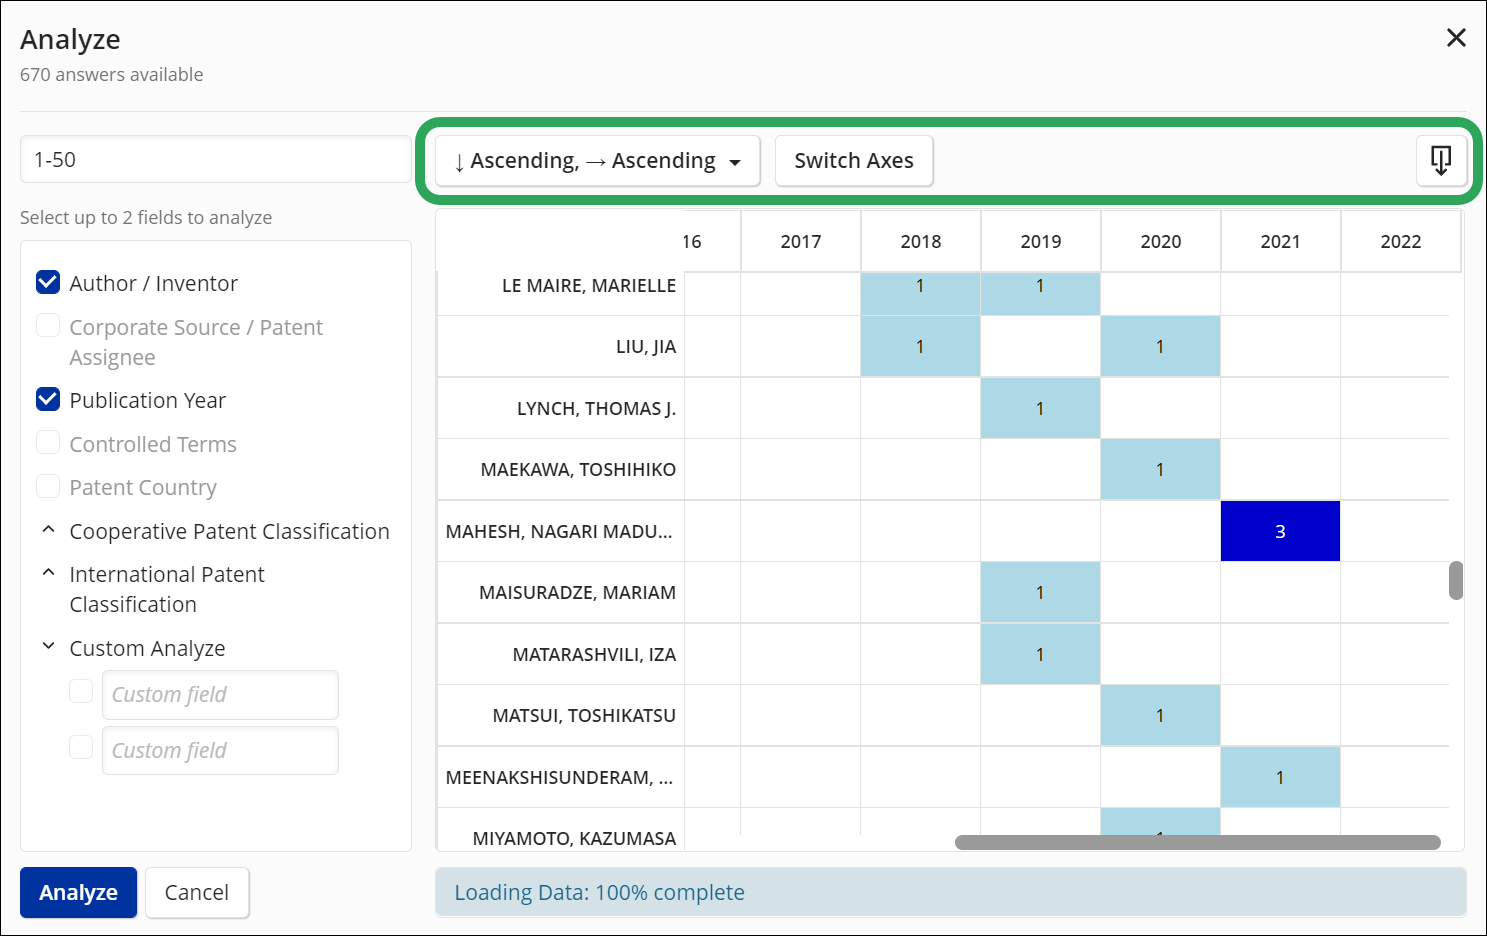
If
you selected two fields, a matrix displays showing the field data
as axes. You may change the display
order, switch the field axes,
and download the matrix as
an .xls file.
The below example displays the number of times an author/inventor name
occurs by publication year for answers 1-50. The color of the cell
is based on the number of occurrences; the darker the color, the higher
the number.

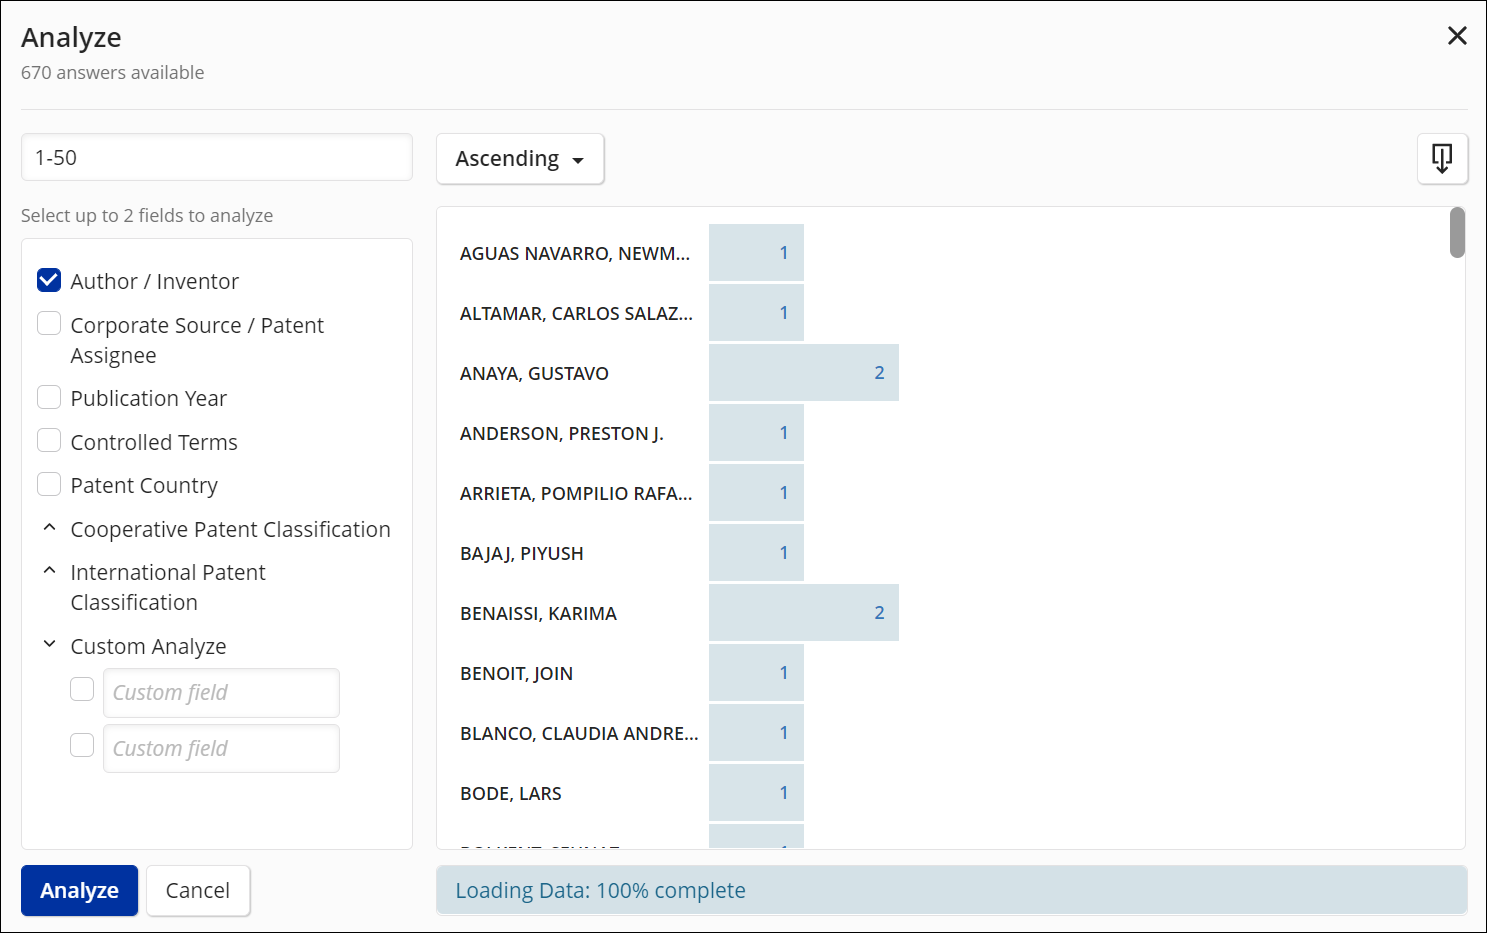
If you select one field, a bar graph displays the field data along
with the number of occurrences for the specified answer set.

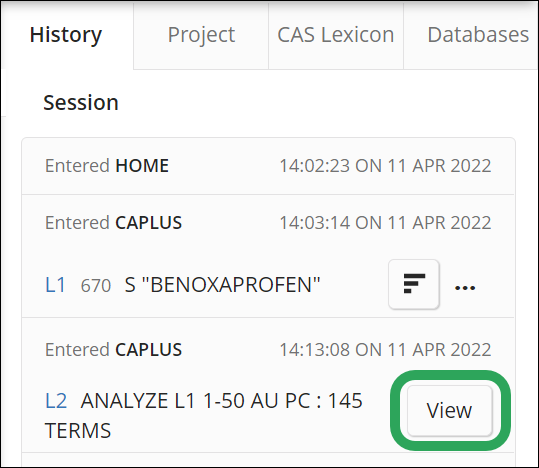
To
open the matrix/graph from the History
tab, click the View button
for the L-number.
